


Skyprint
Make sense of
your airspace
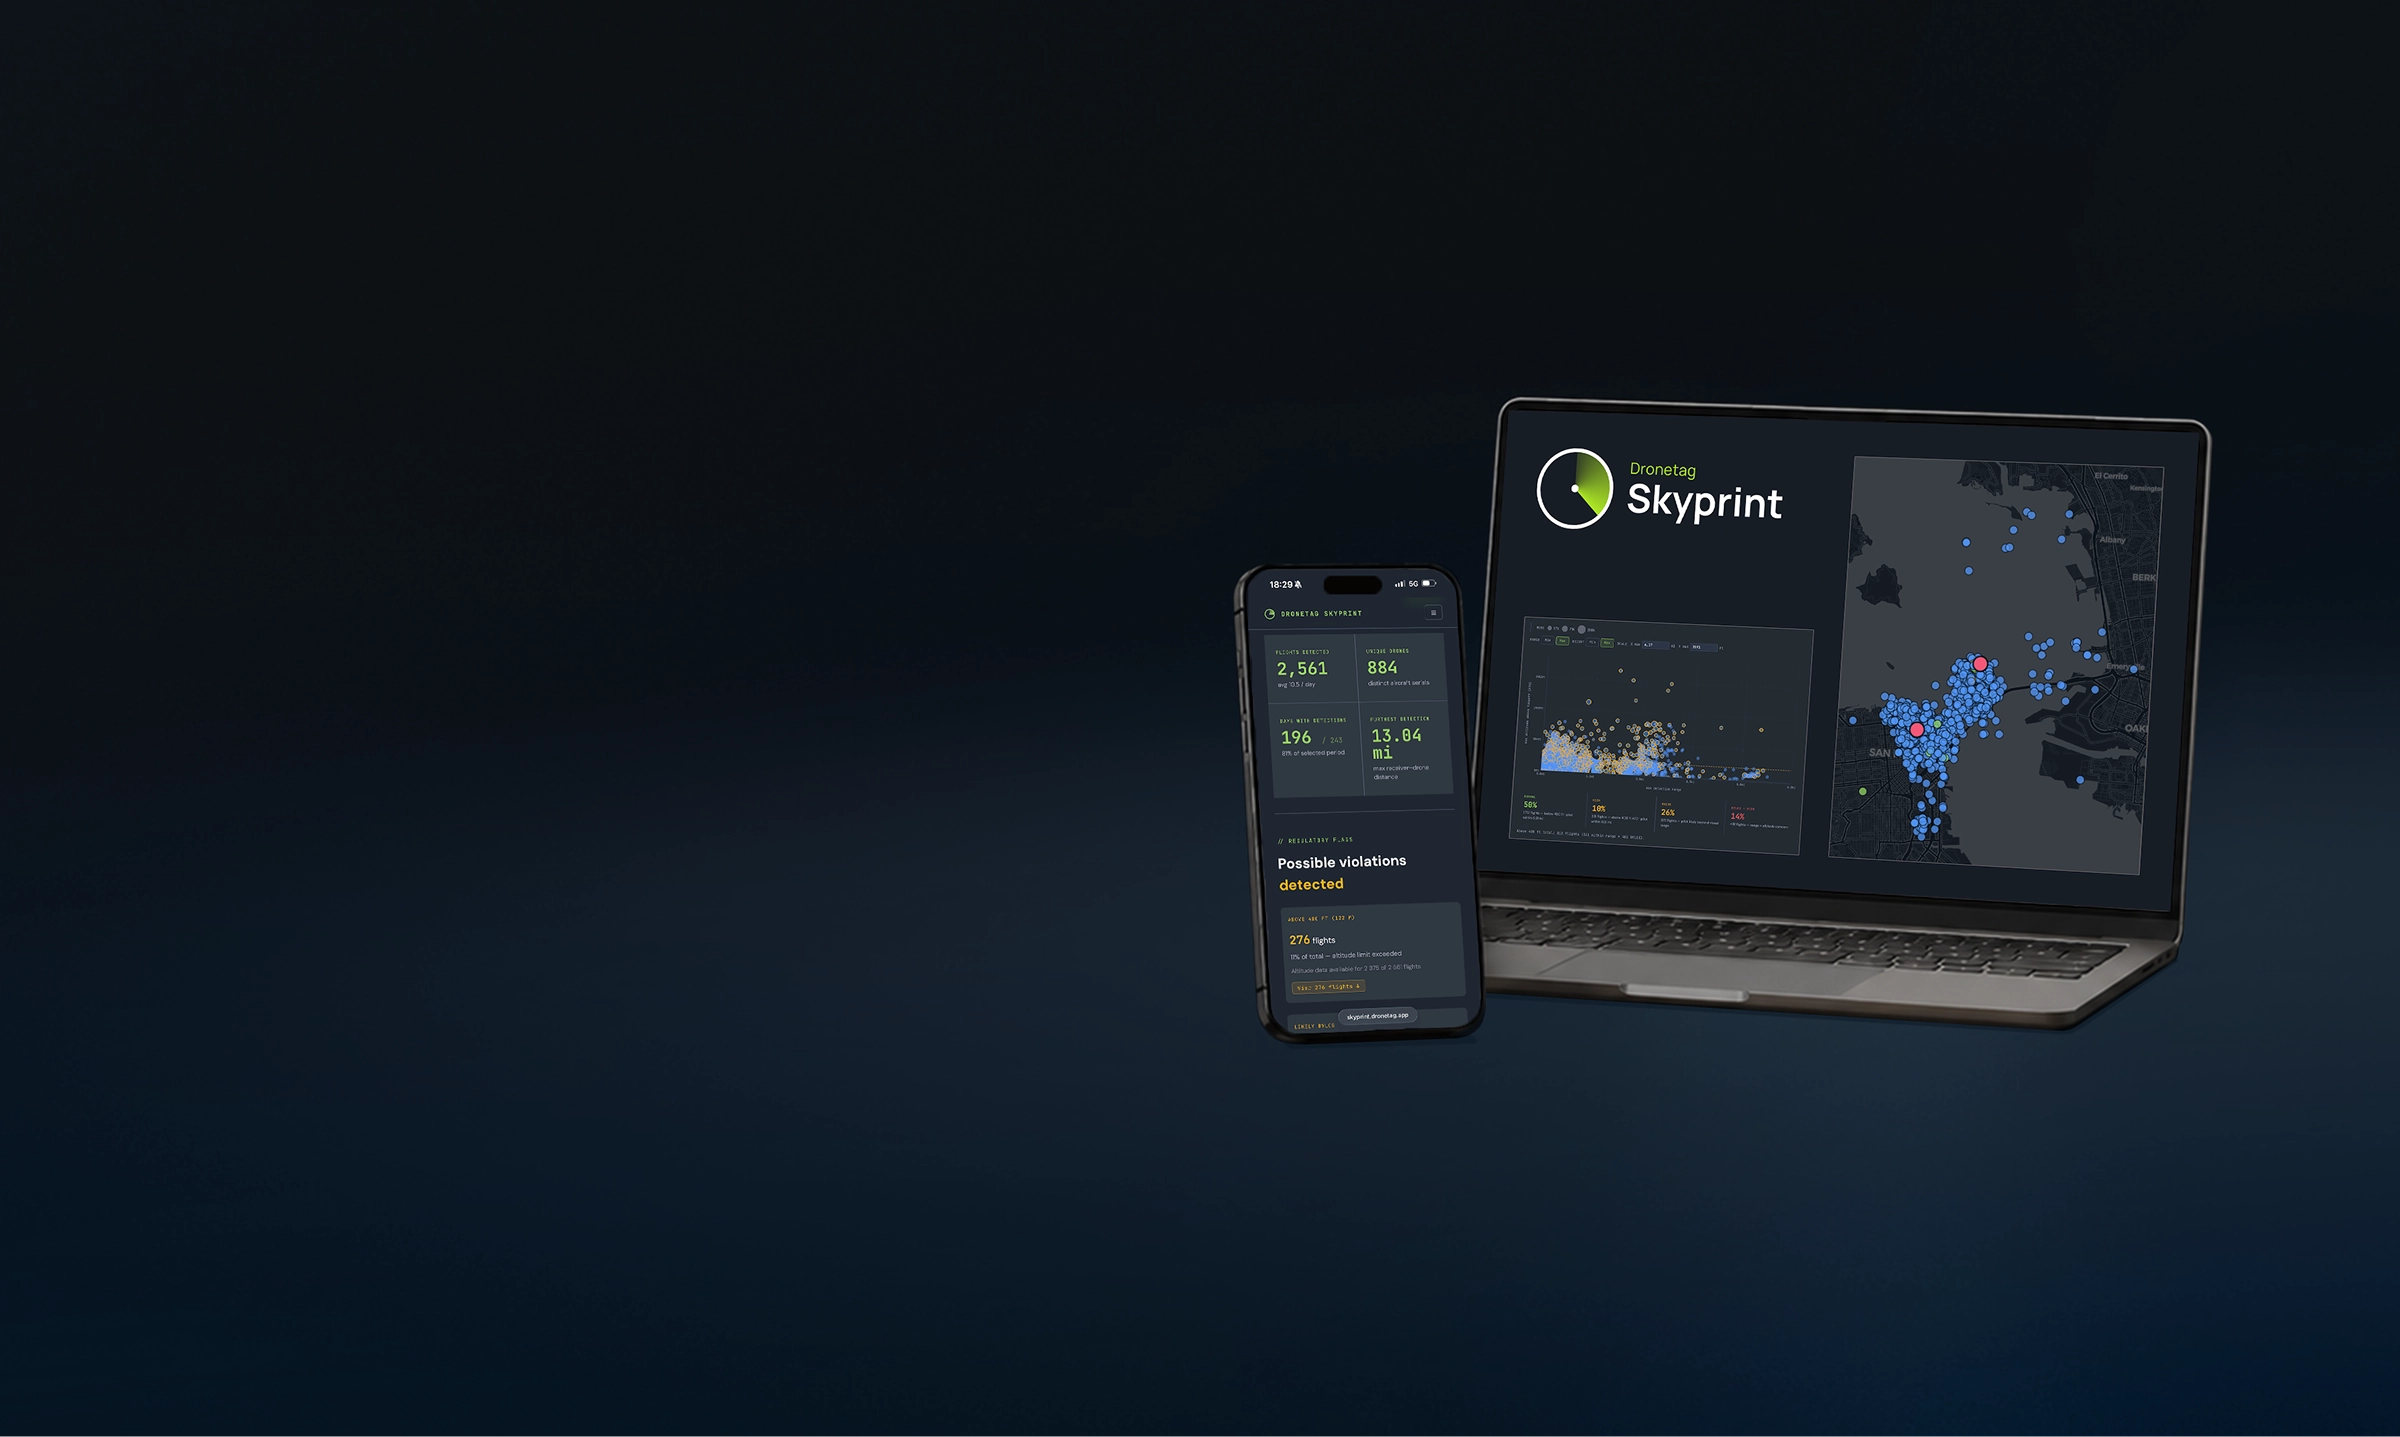
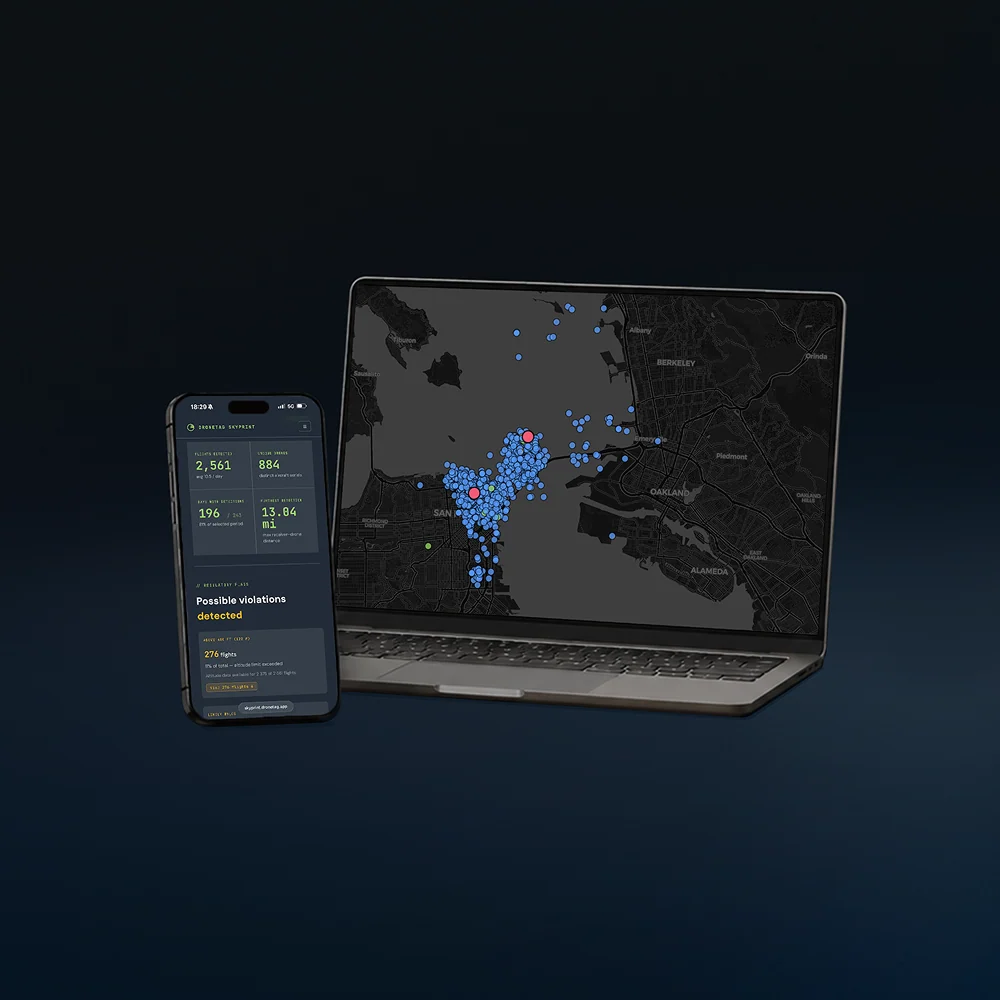
Skyprint turns detection data into a live, interactive report. The team watching the airspace uses it to understand what is flying and decide what to do. Whoever they report to uses it to see the value of the deployment. Same data, one tool, built for both.
Understand and
decide
Drill into any flight, trace a returning drone across days, check which flights crossed the altitude limit or were likely flown beyond line of sight. The interactive report is a working surface, not a snapshot, so the people on the ground can read the situation and act on it.
See the value,
on paper
Schedule regular reports, export to PDF or share a link. A chief, a city, or a customer sees what the deployment has picked up over the period, in a form built to be handed over, without anyone needing to log in or interpret a raw dashboard.
Real-time lives in the App. Reporting lives here.
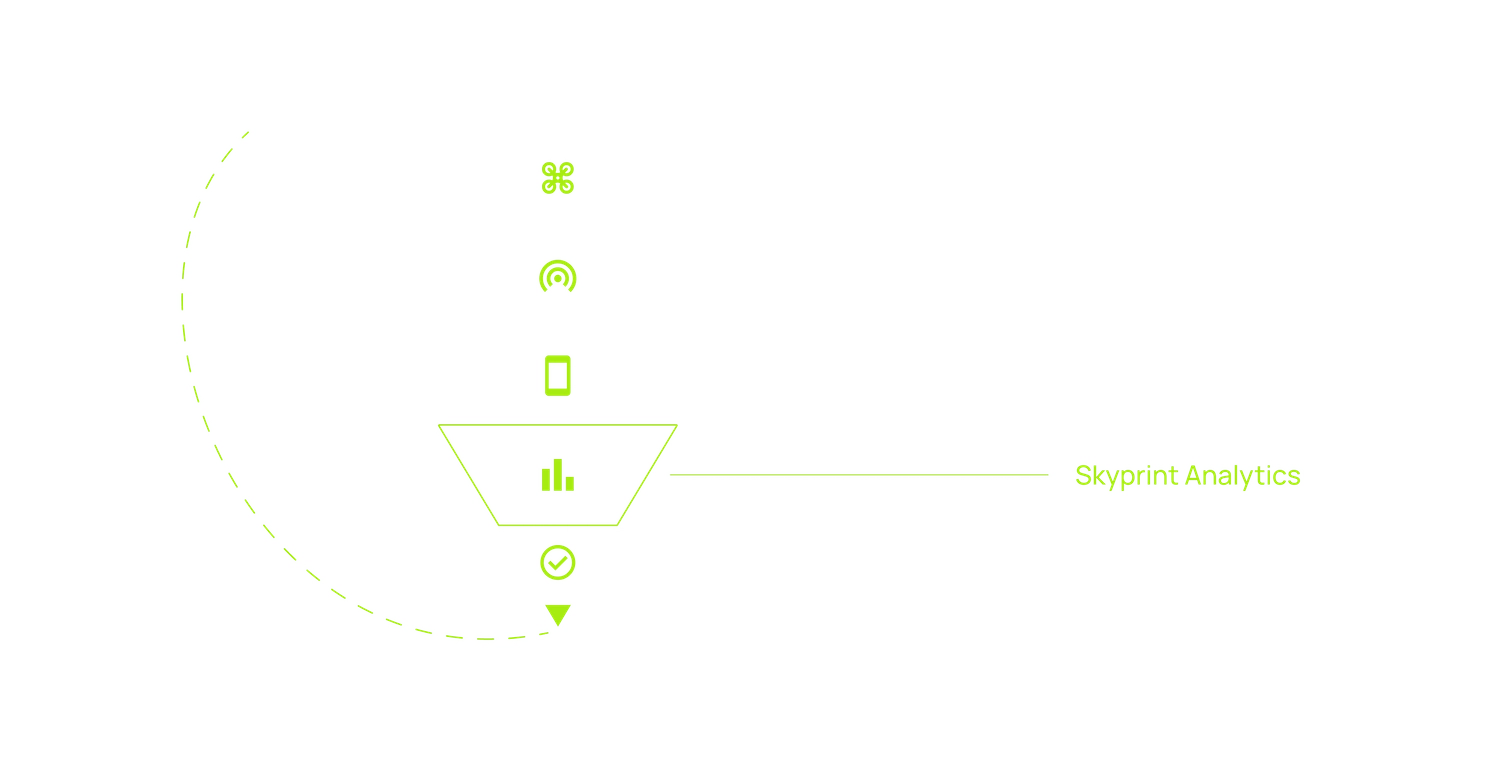
Skyprint adds to the Dronetag ecosystem rather than replacing any part of it. Pick a receiver or your whole fleet and a time window, and it builds a report you work inside.
From the headline number down to
the raw flight

Spot the flights that need
review.
Skyprint highlights flights that may warrant attention, and shows how much of the data each flag is based on. These are indicators for the team to review, not legal determinations.

Above the limit
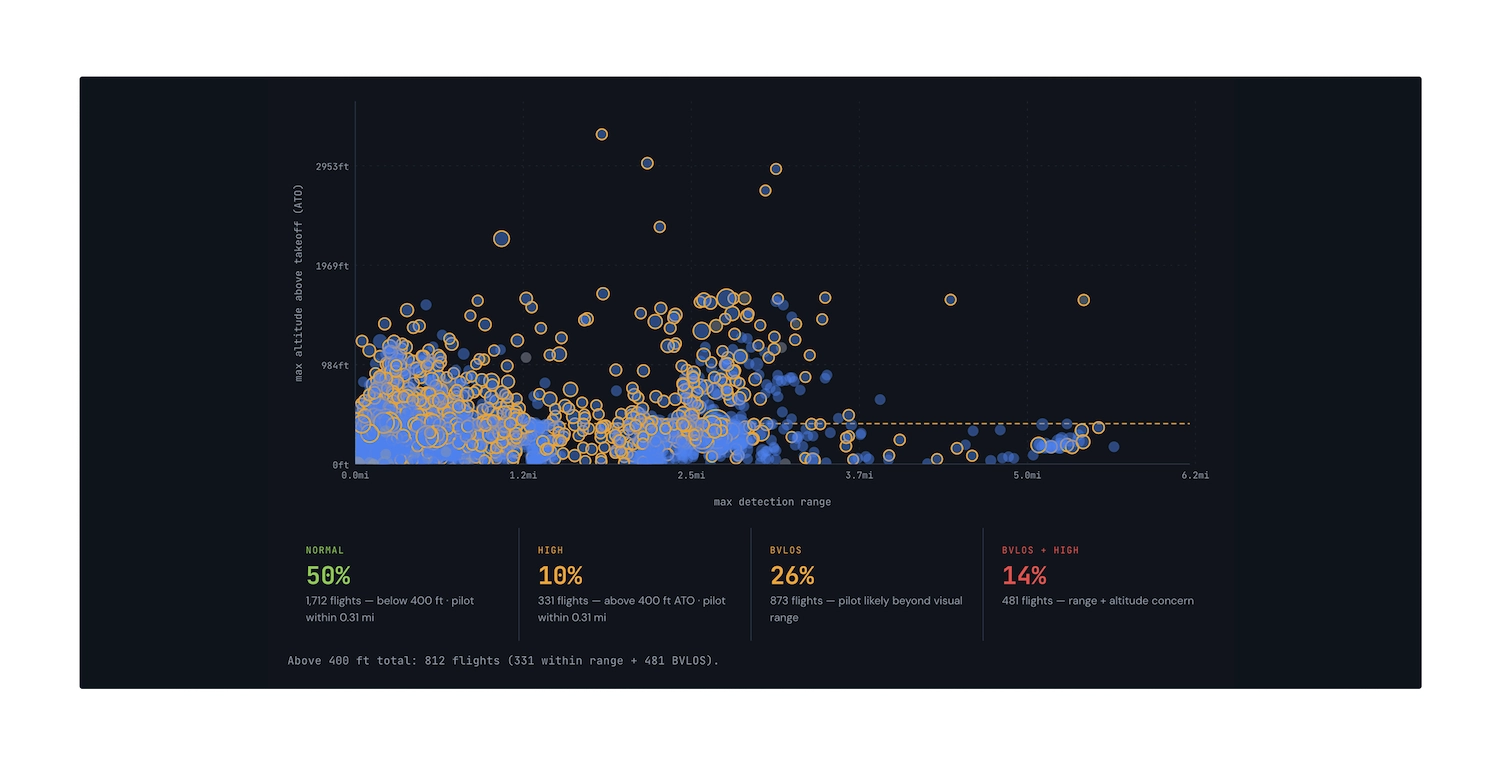
Flights recorded above the 400 ft / 120 m ceiling.

Likely beyond of sight
Flights where the operator was more than 0.3 mi / 500 m from the drone.

No operator ID
EU flights broadcasting Remote ID with no UAS Operator ID present.

Don't take our word for it. Click in.
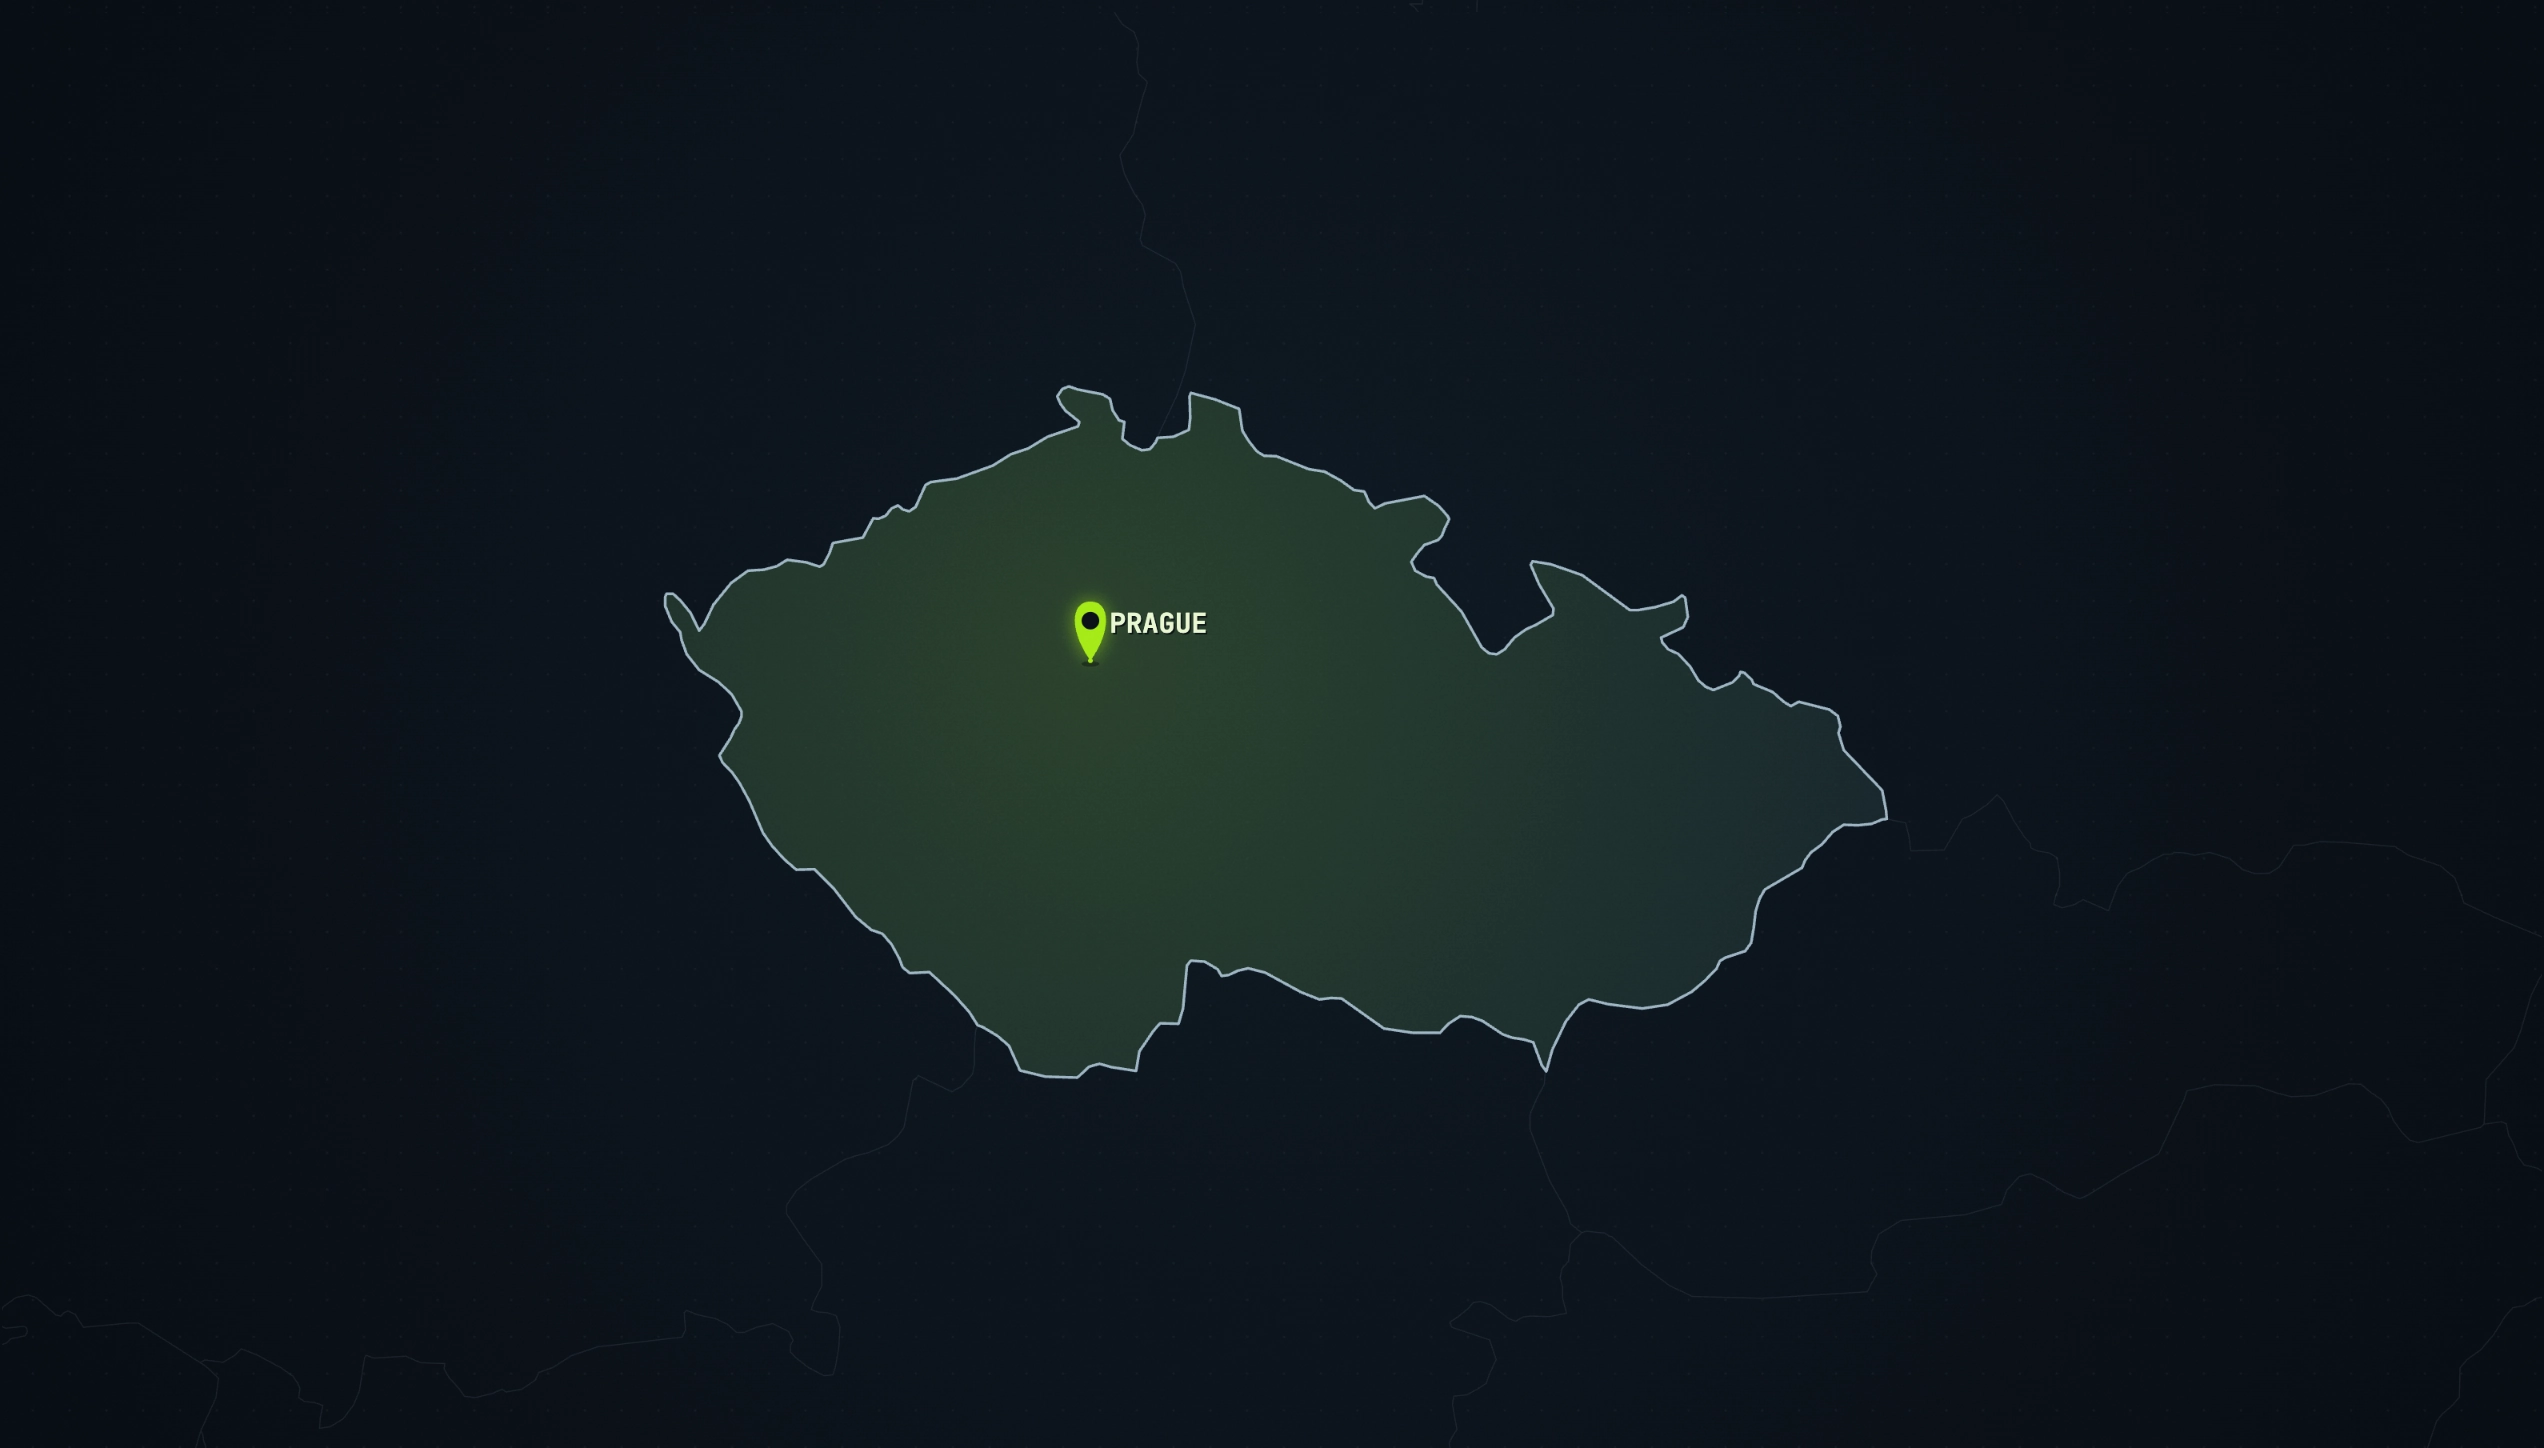
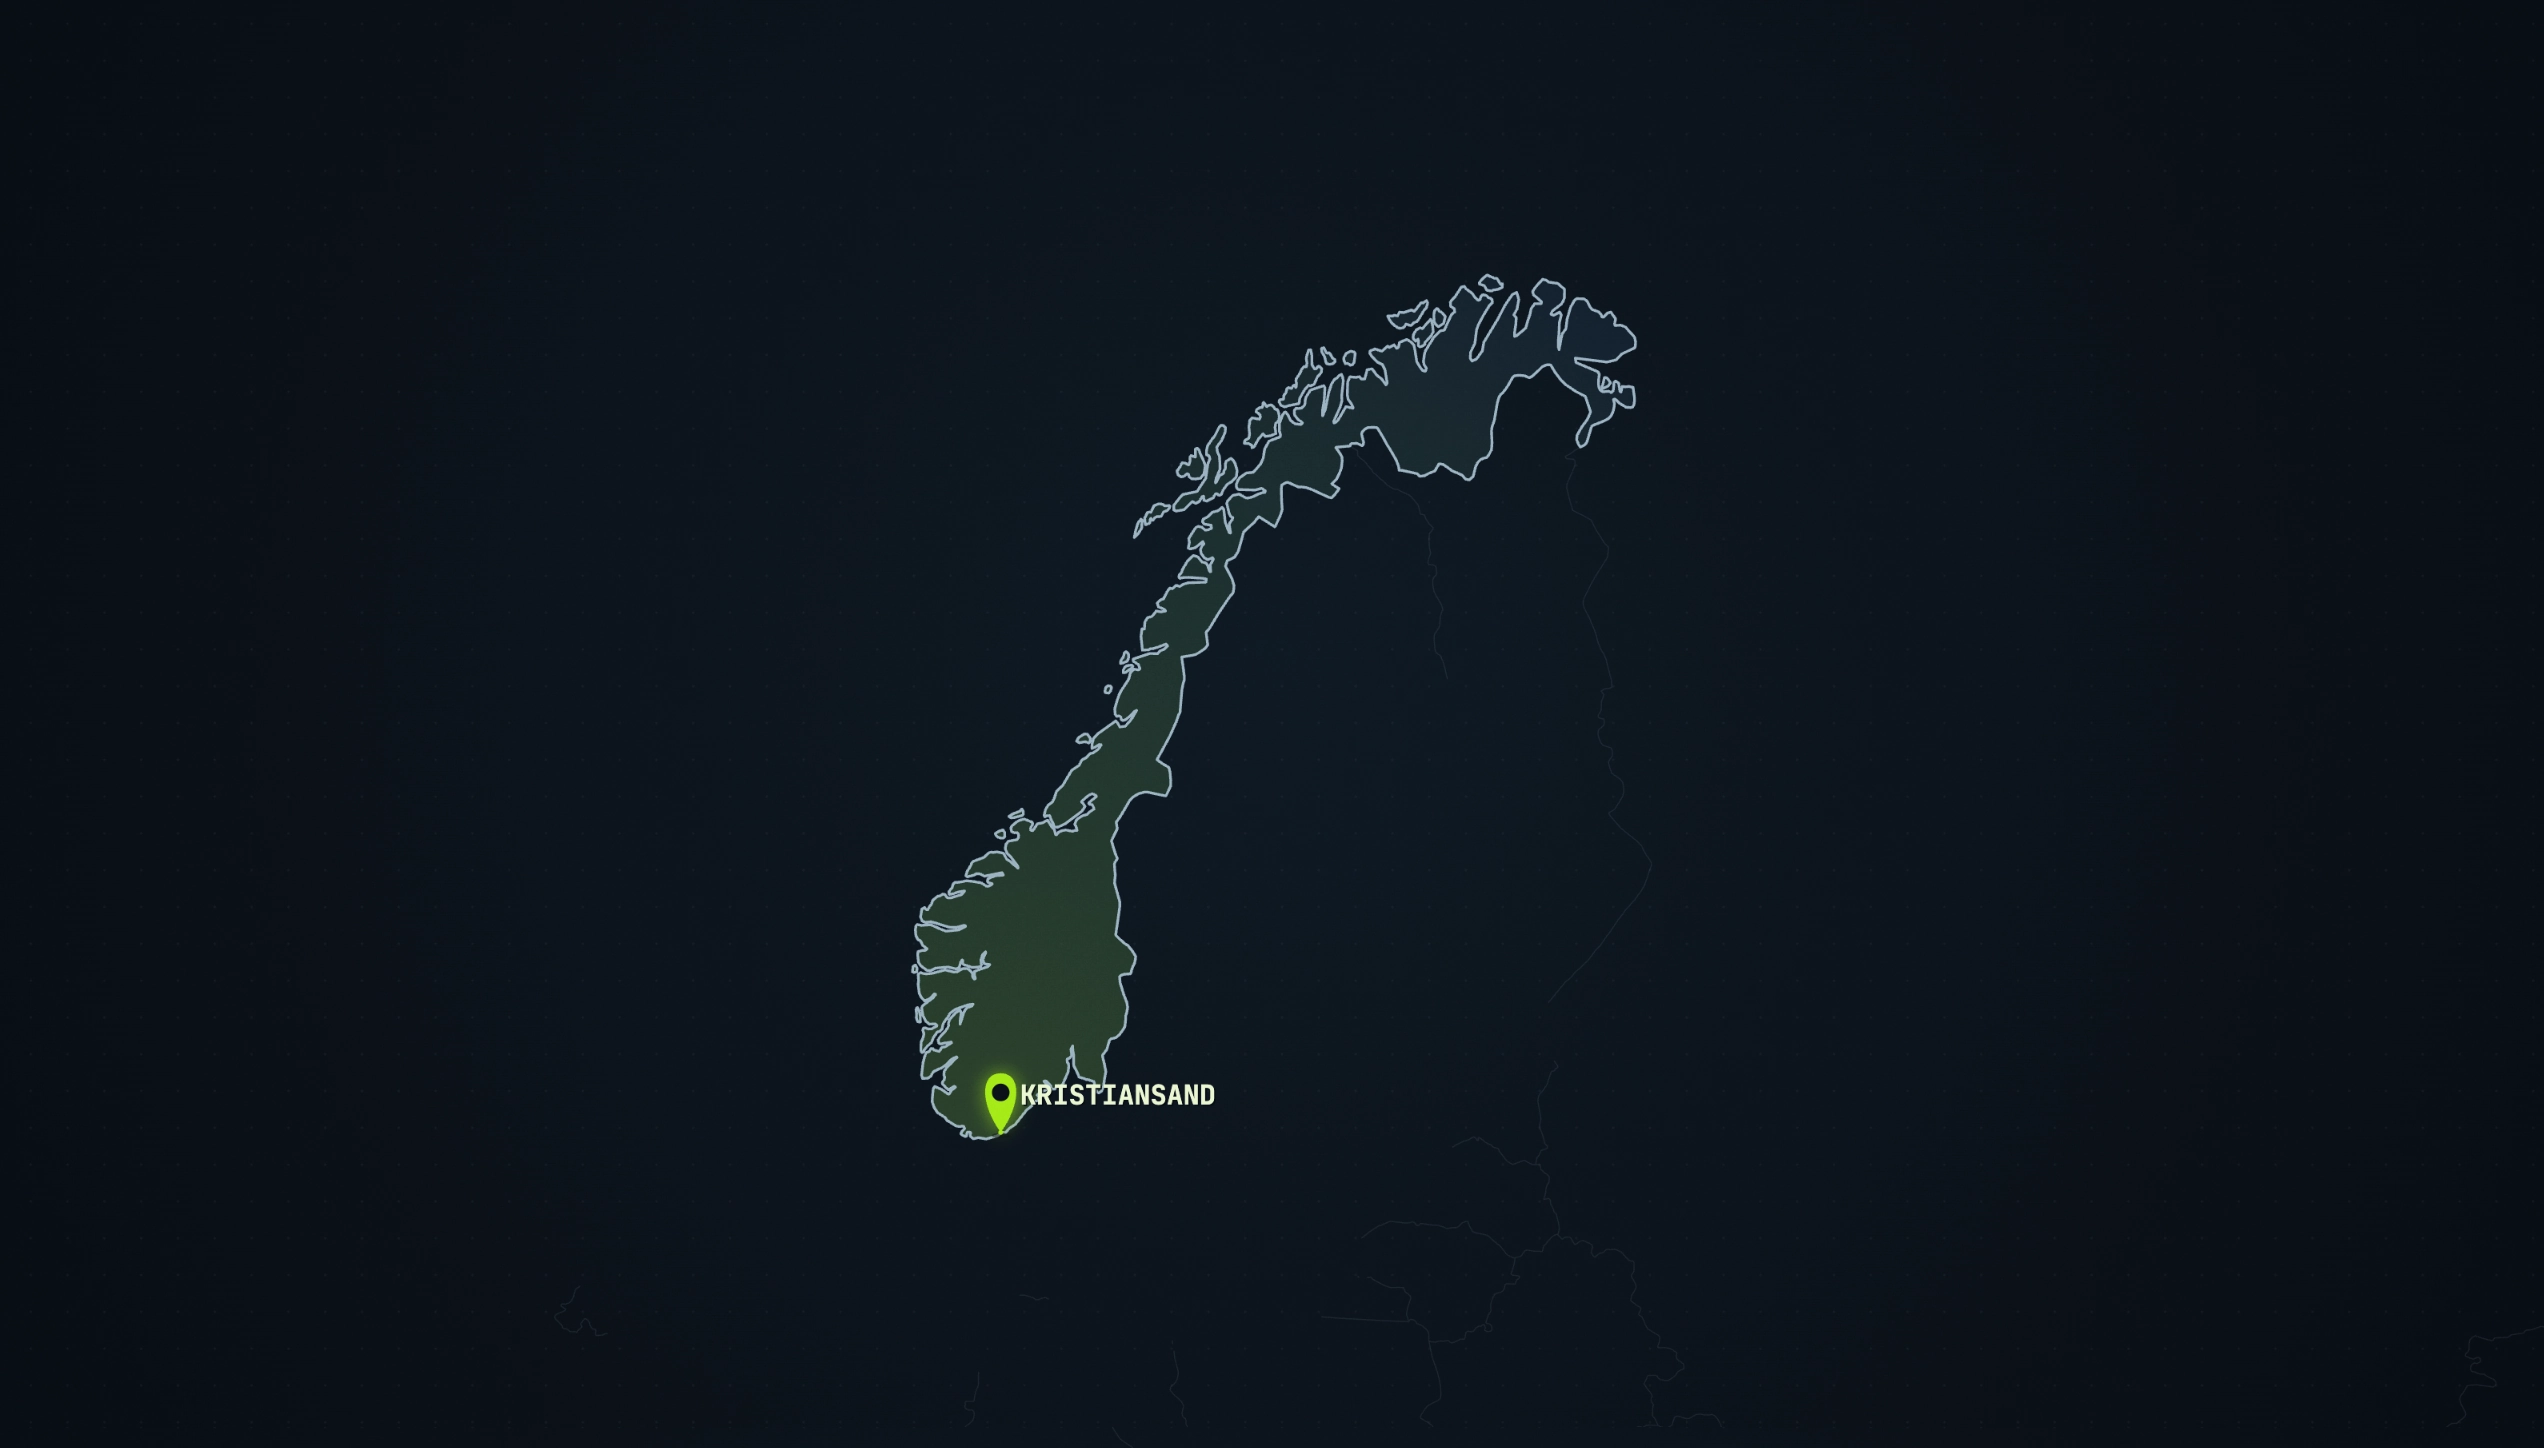
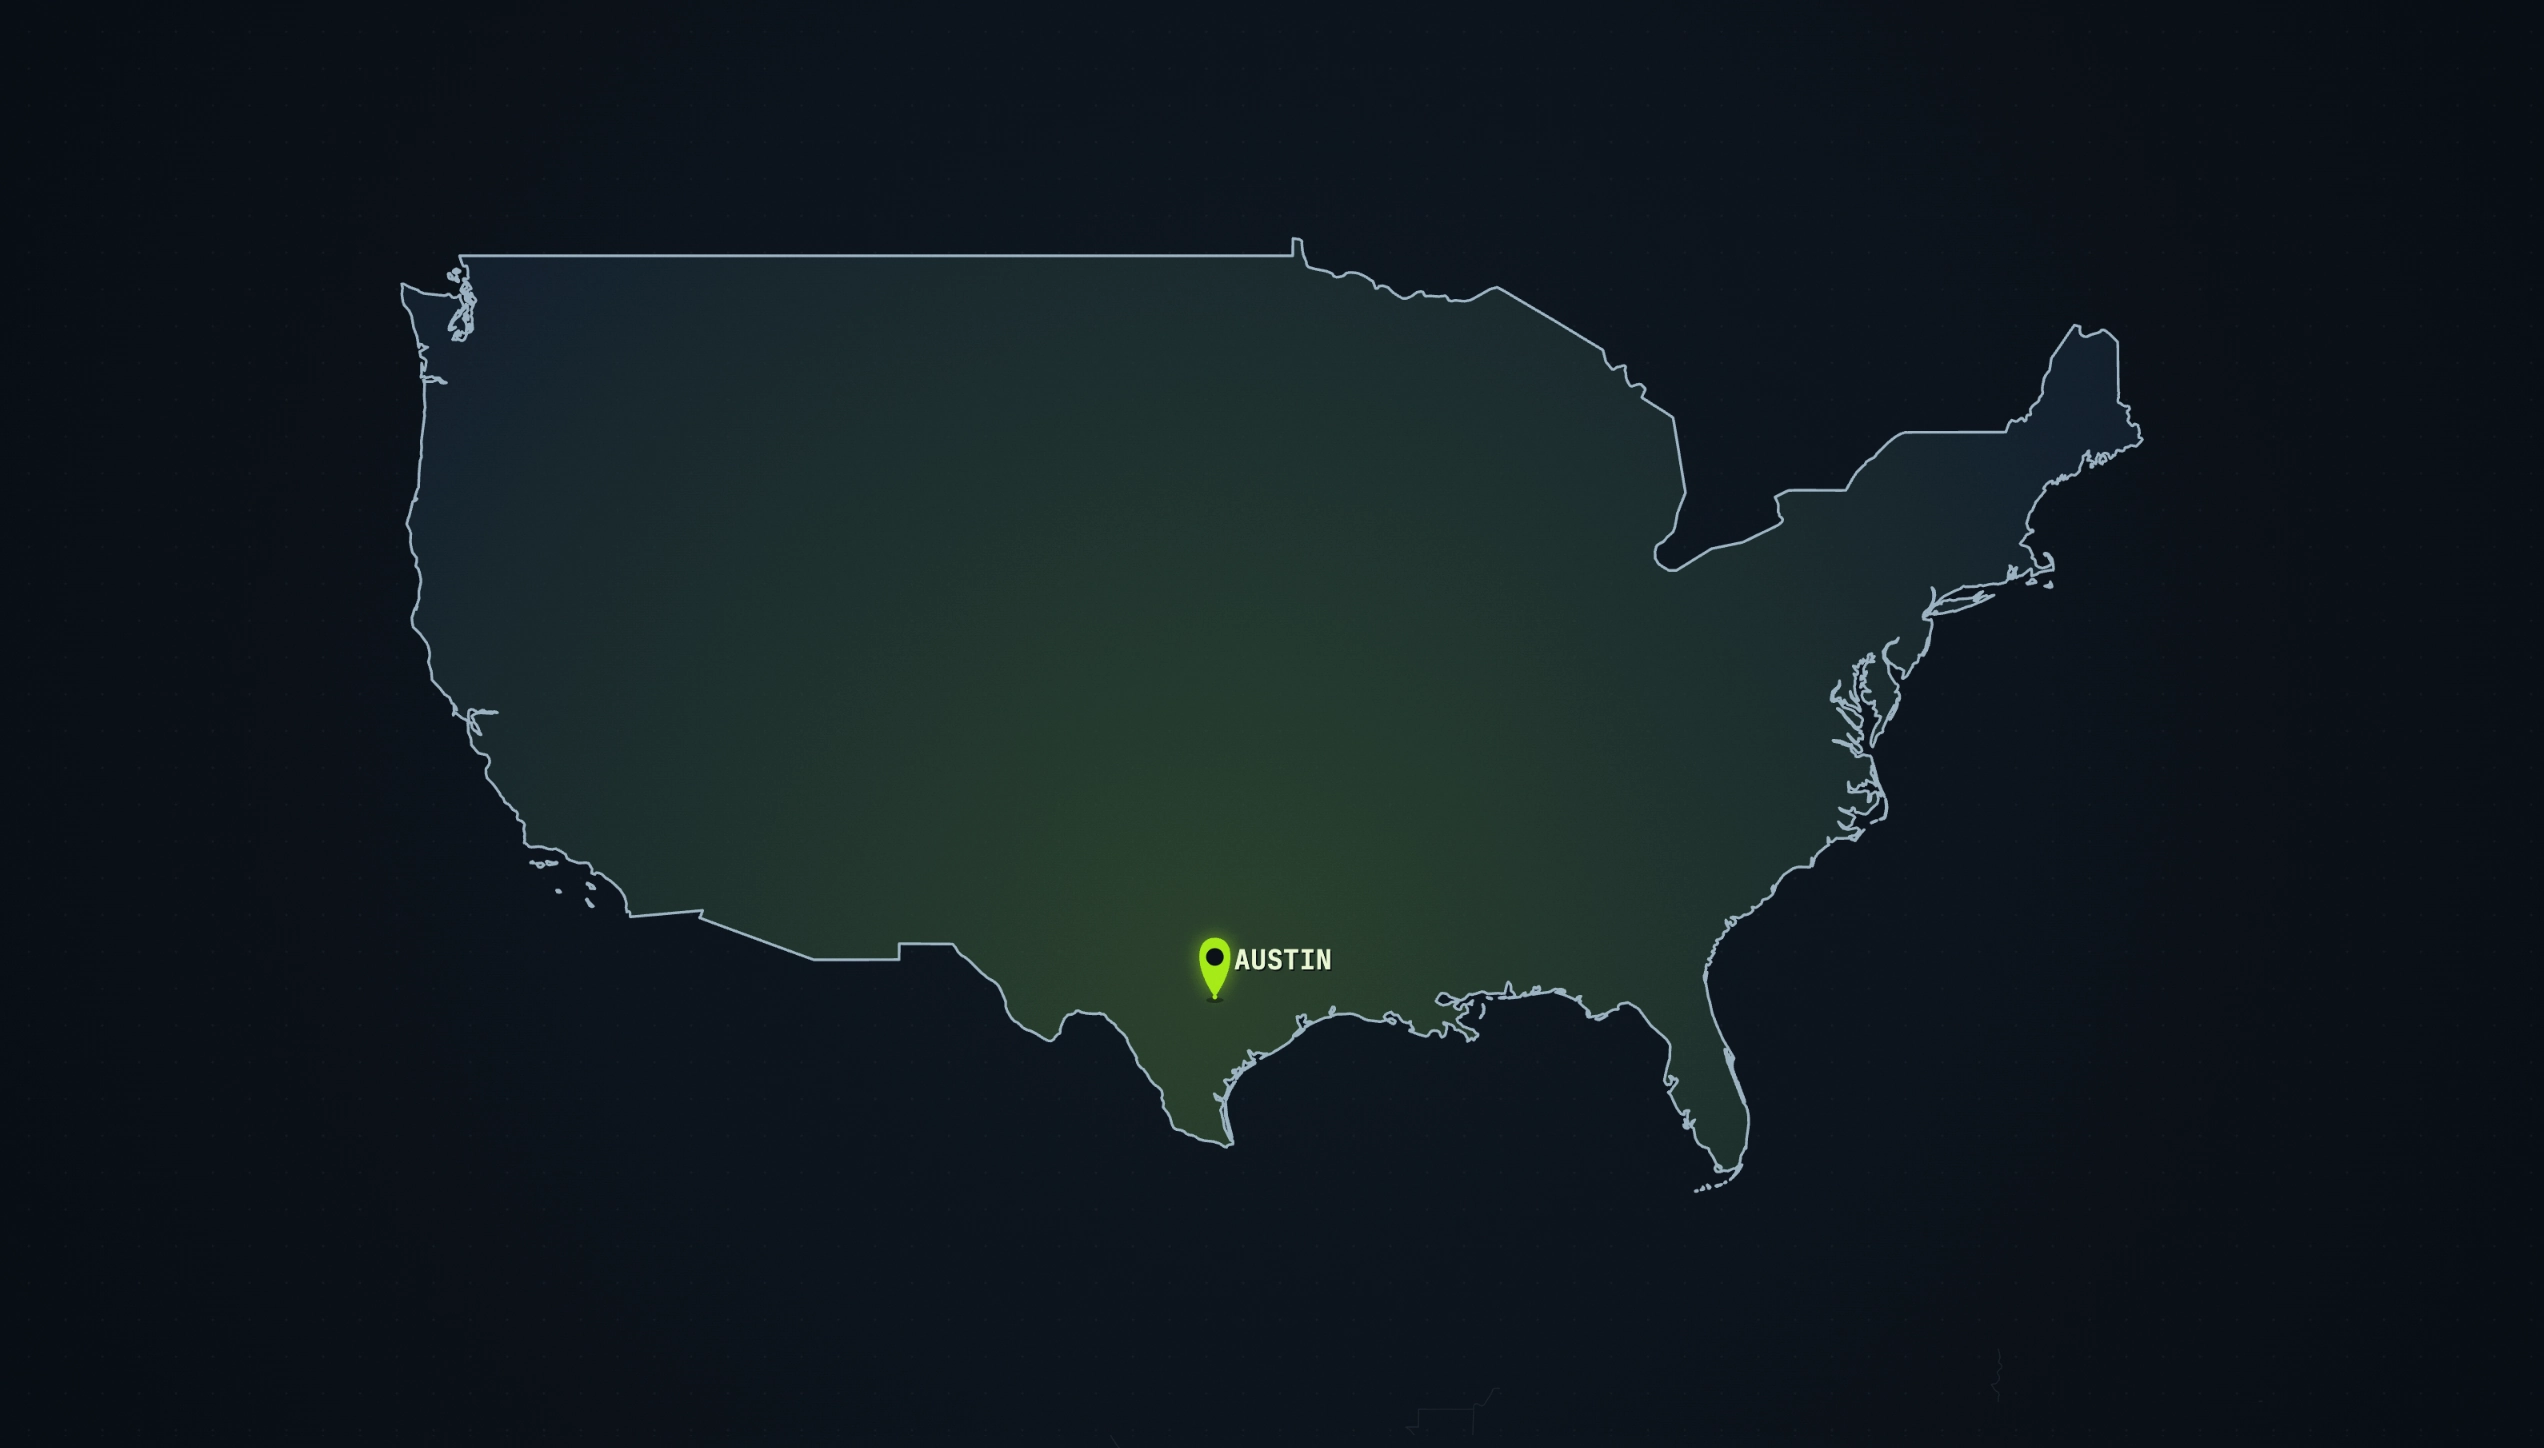
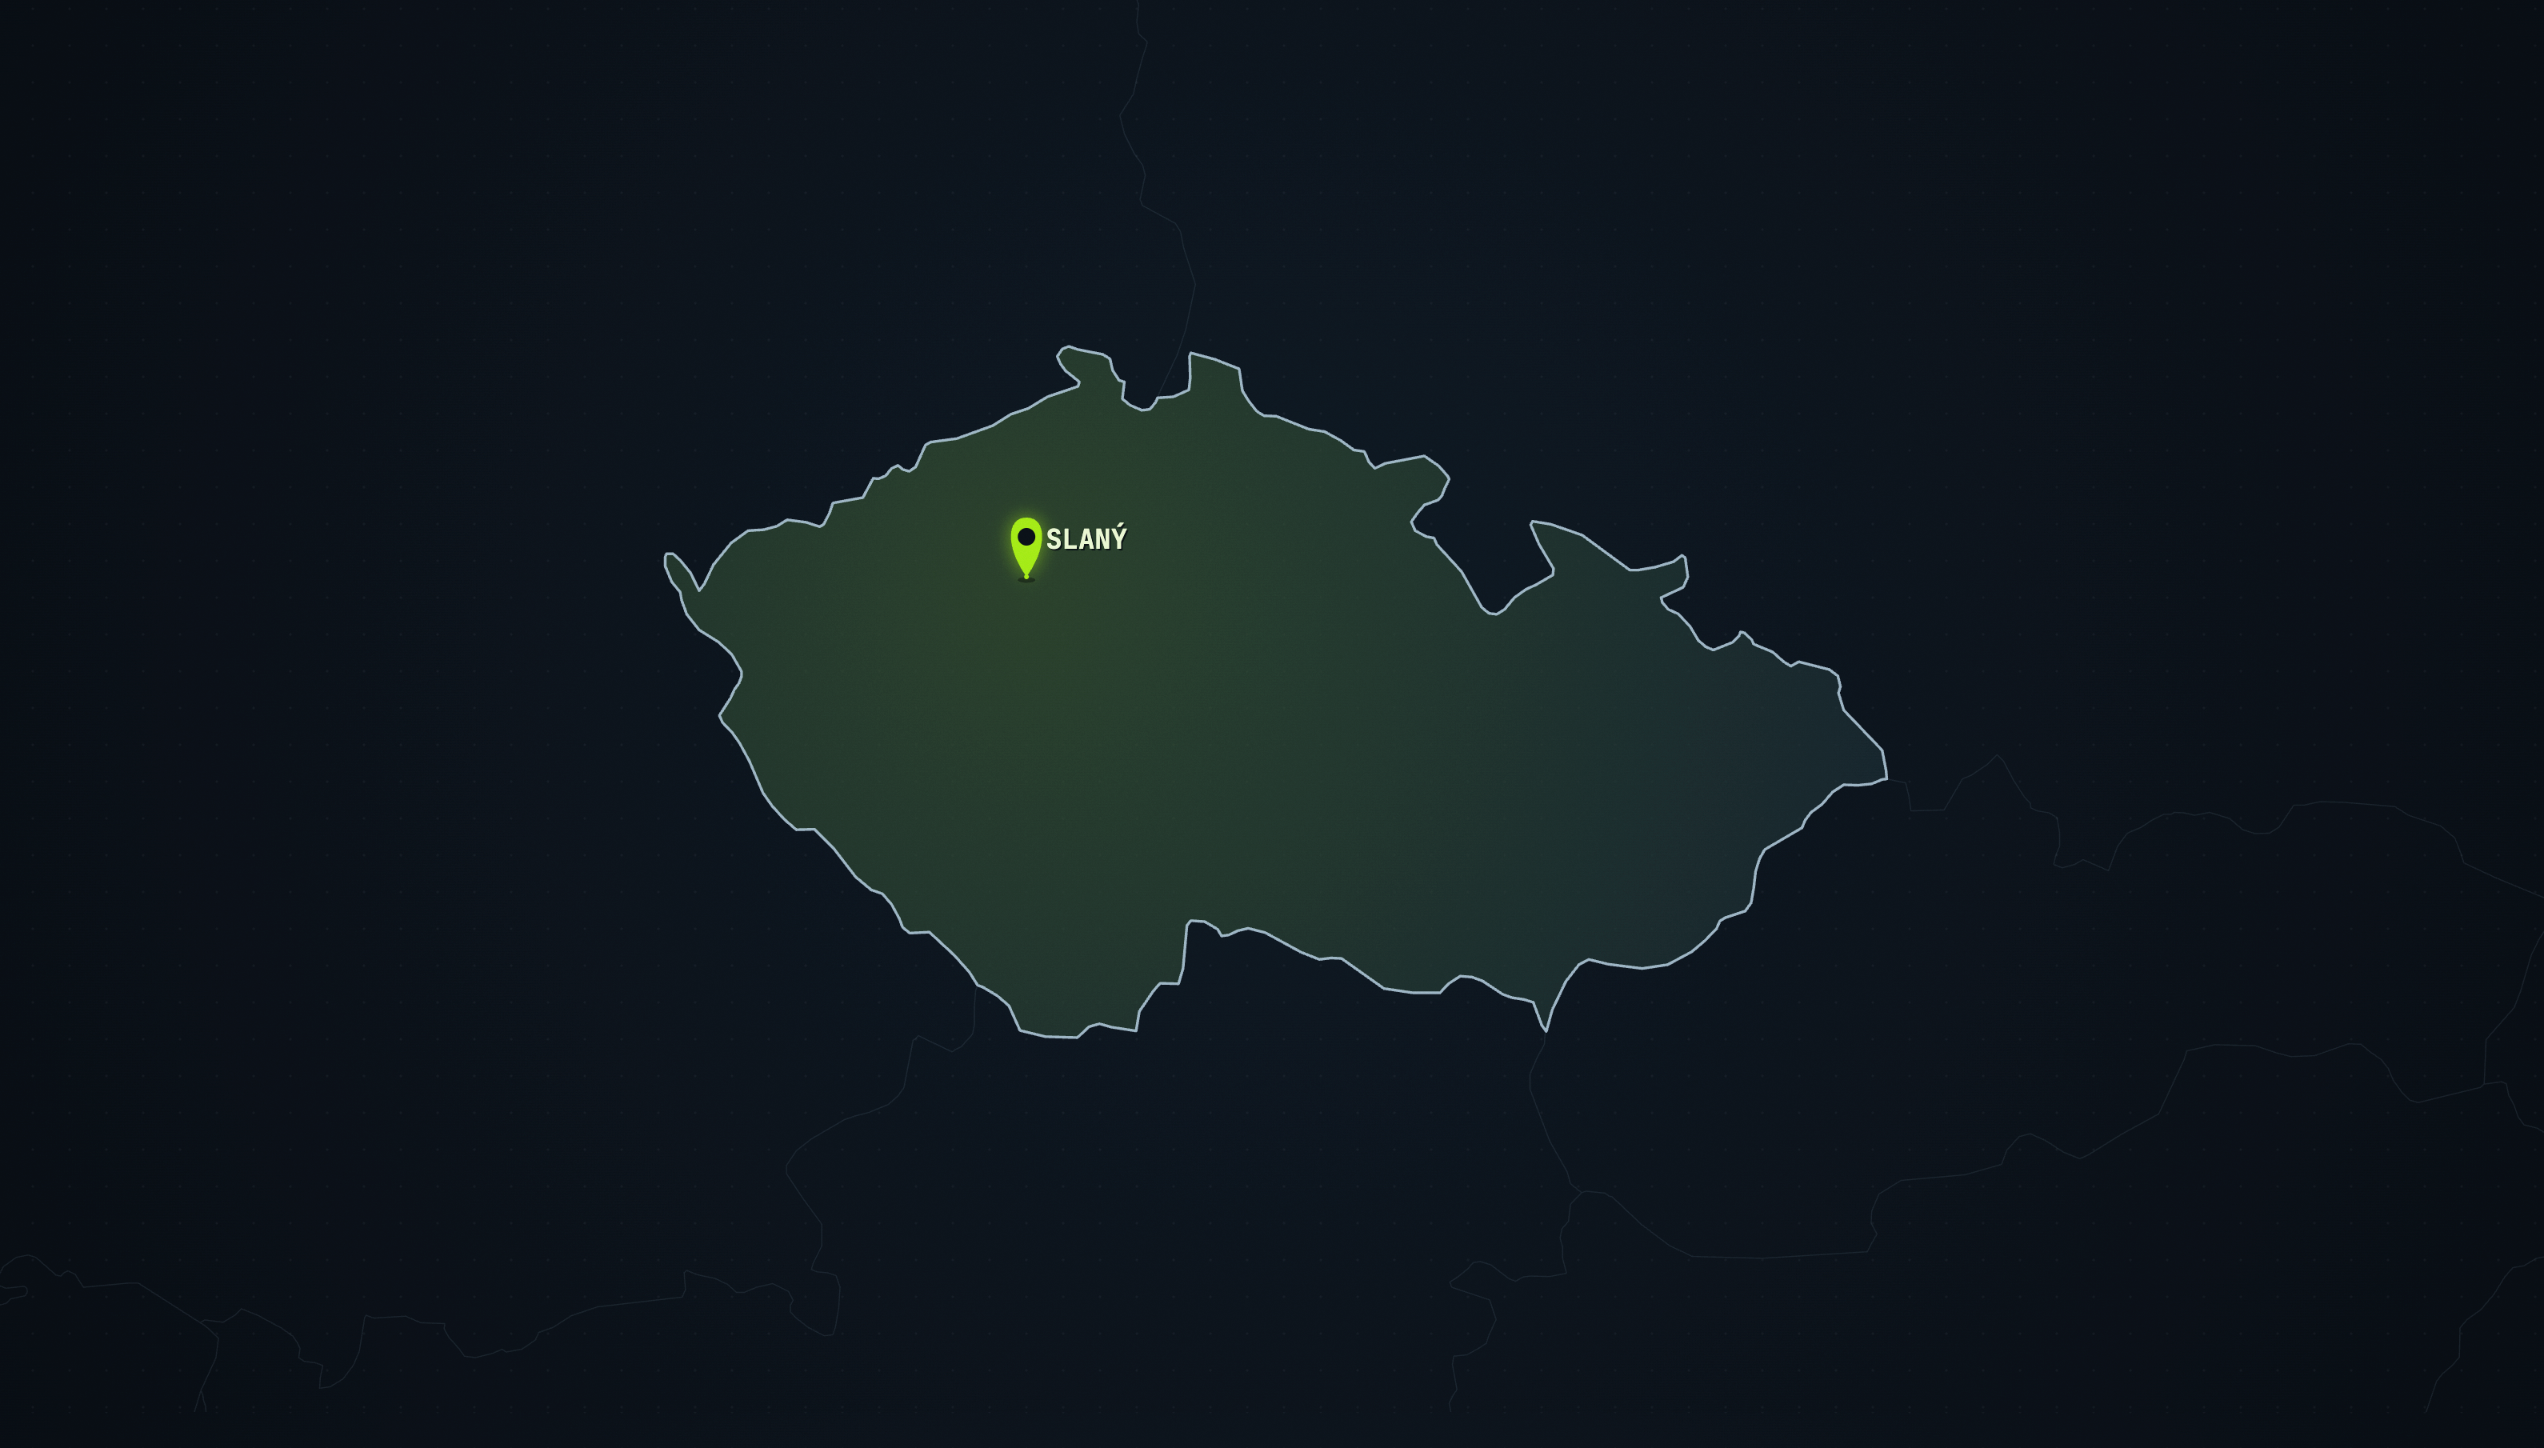
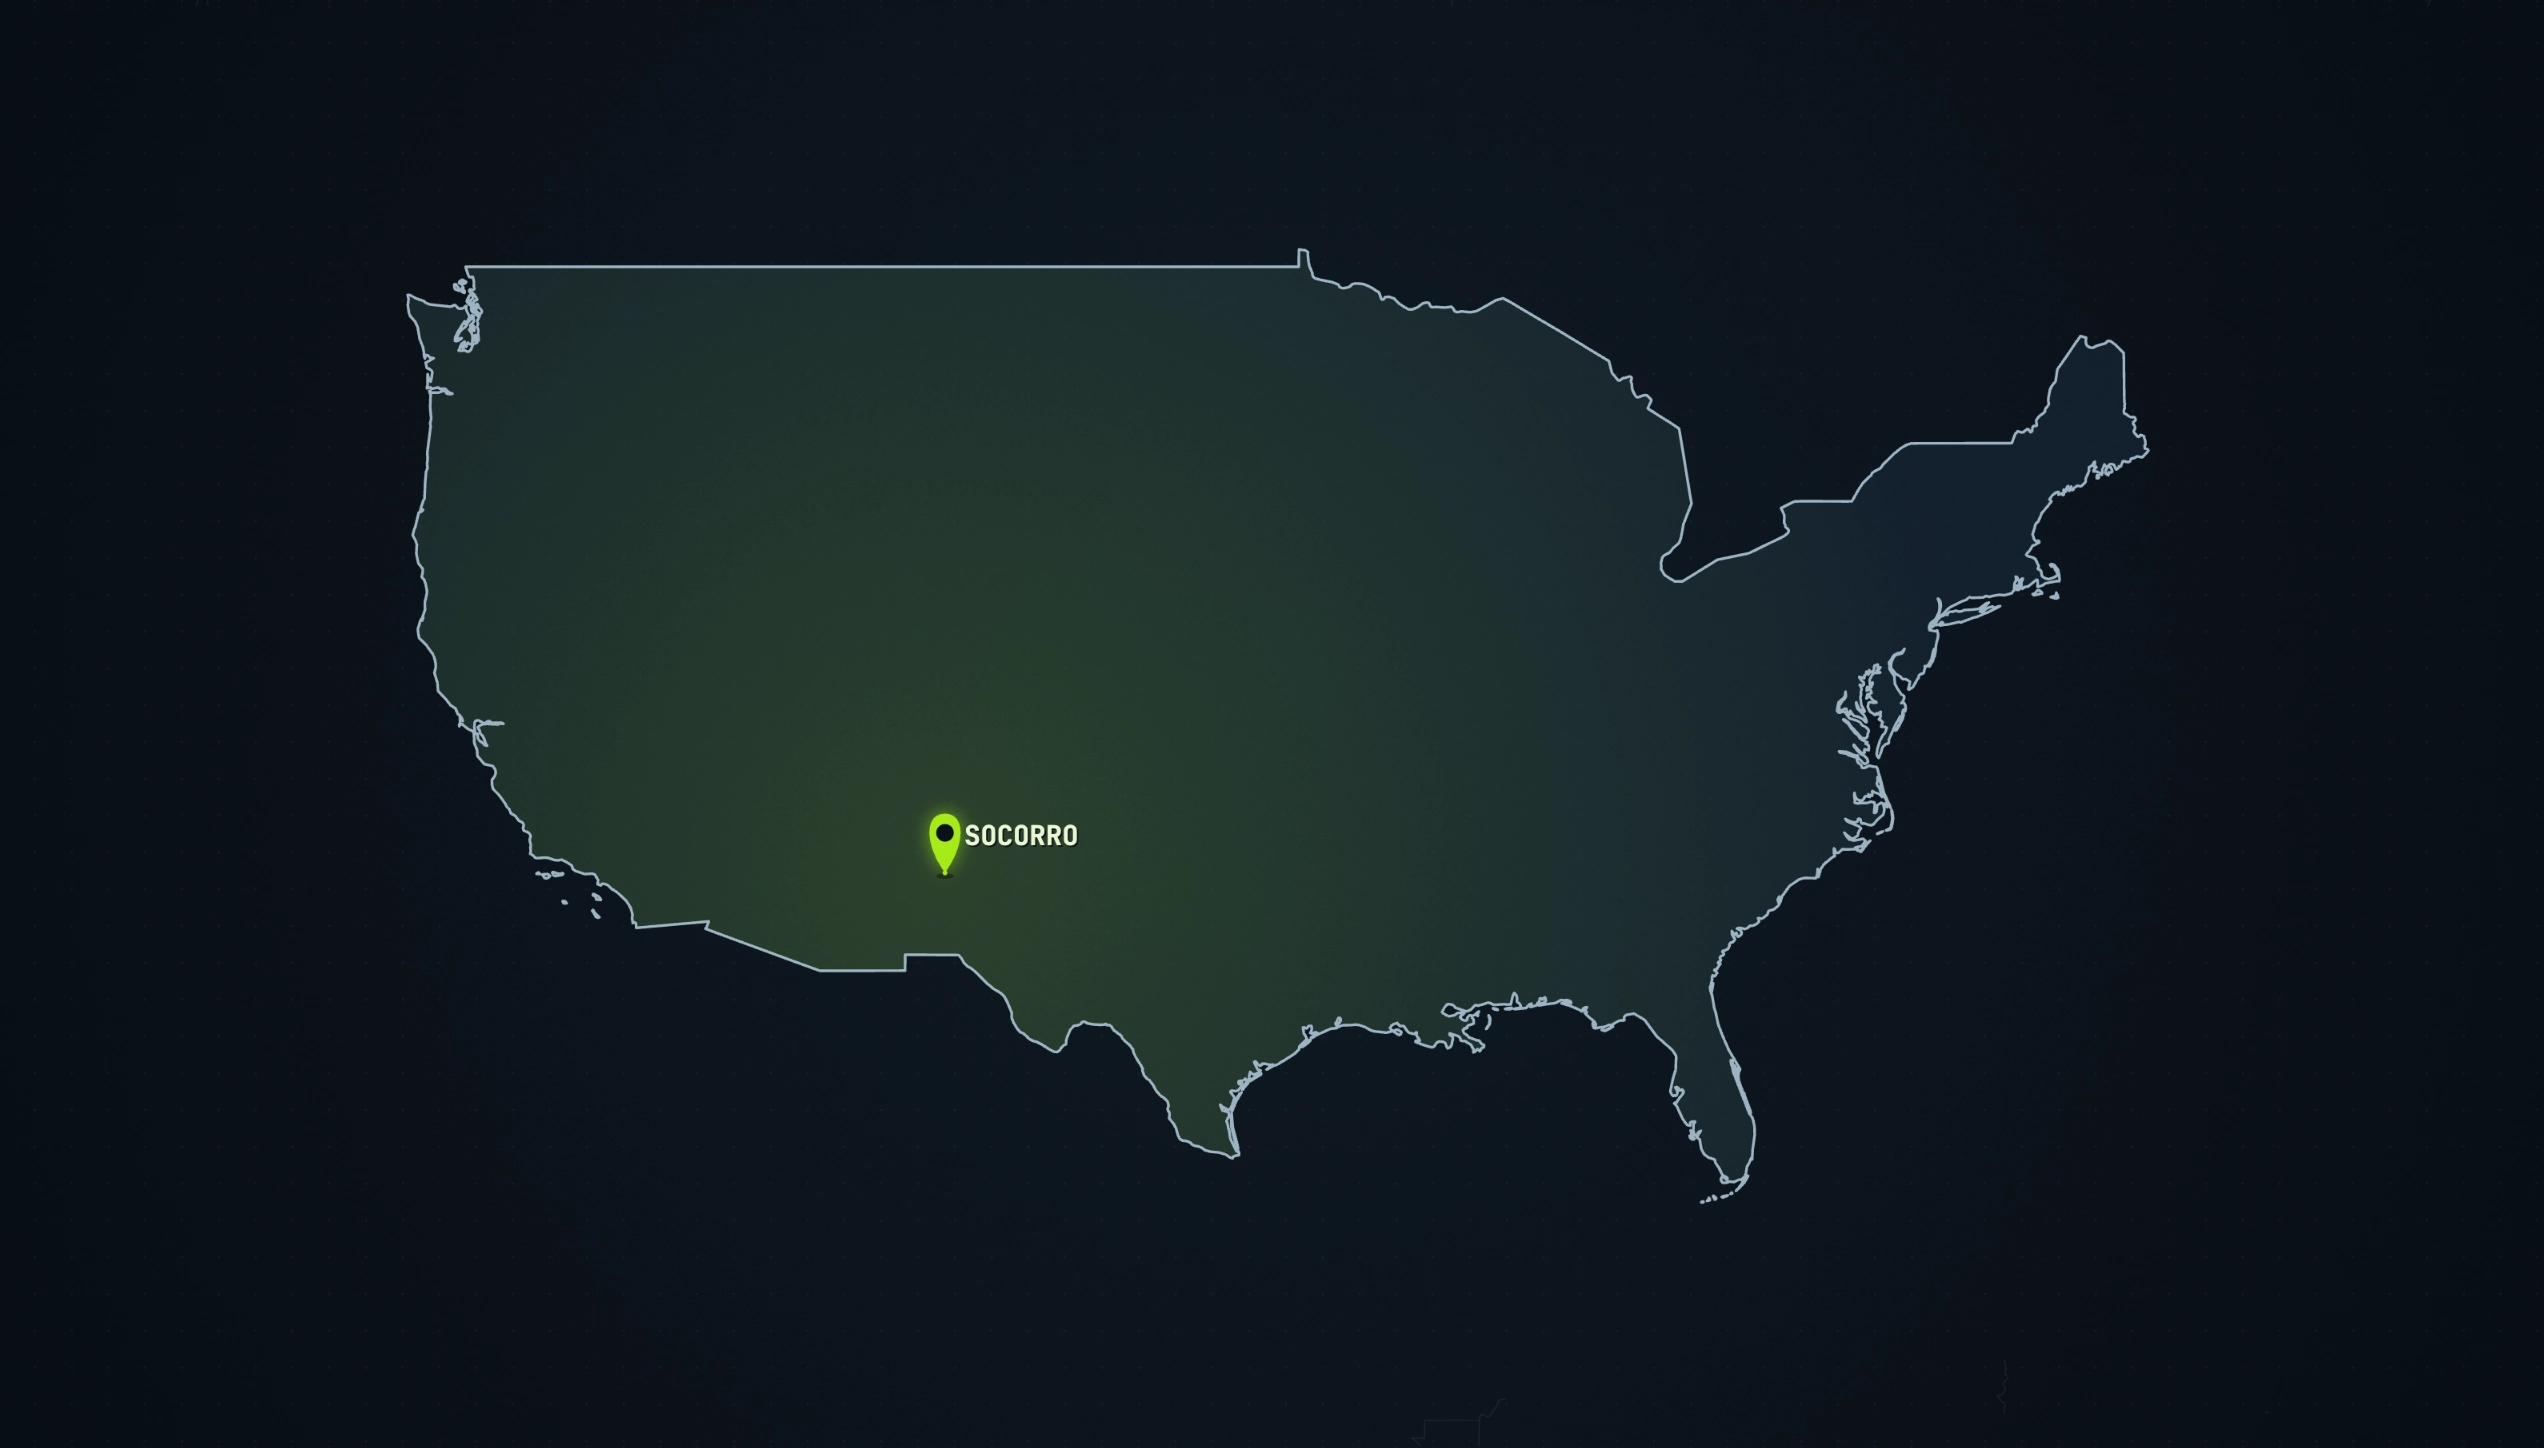
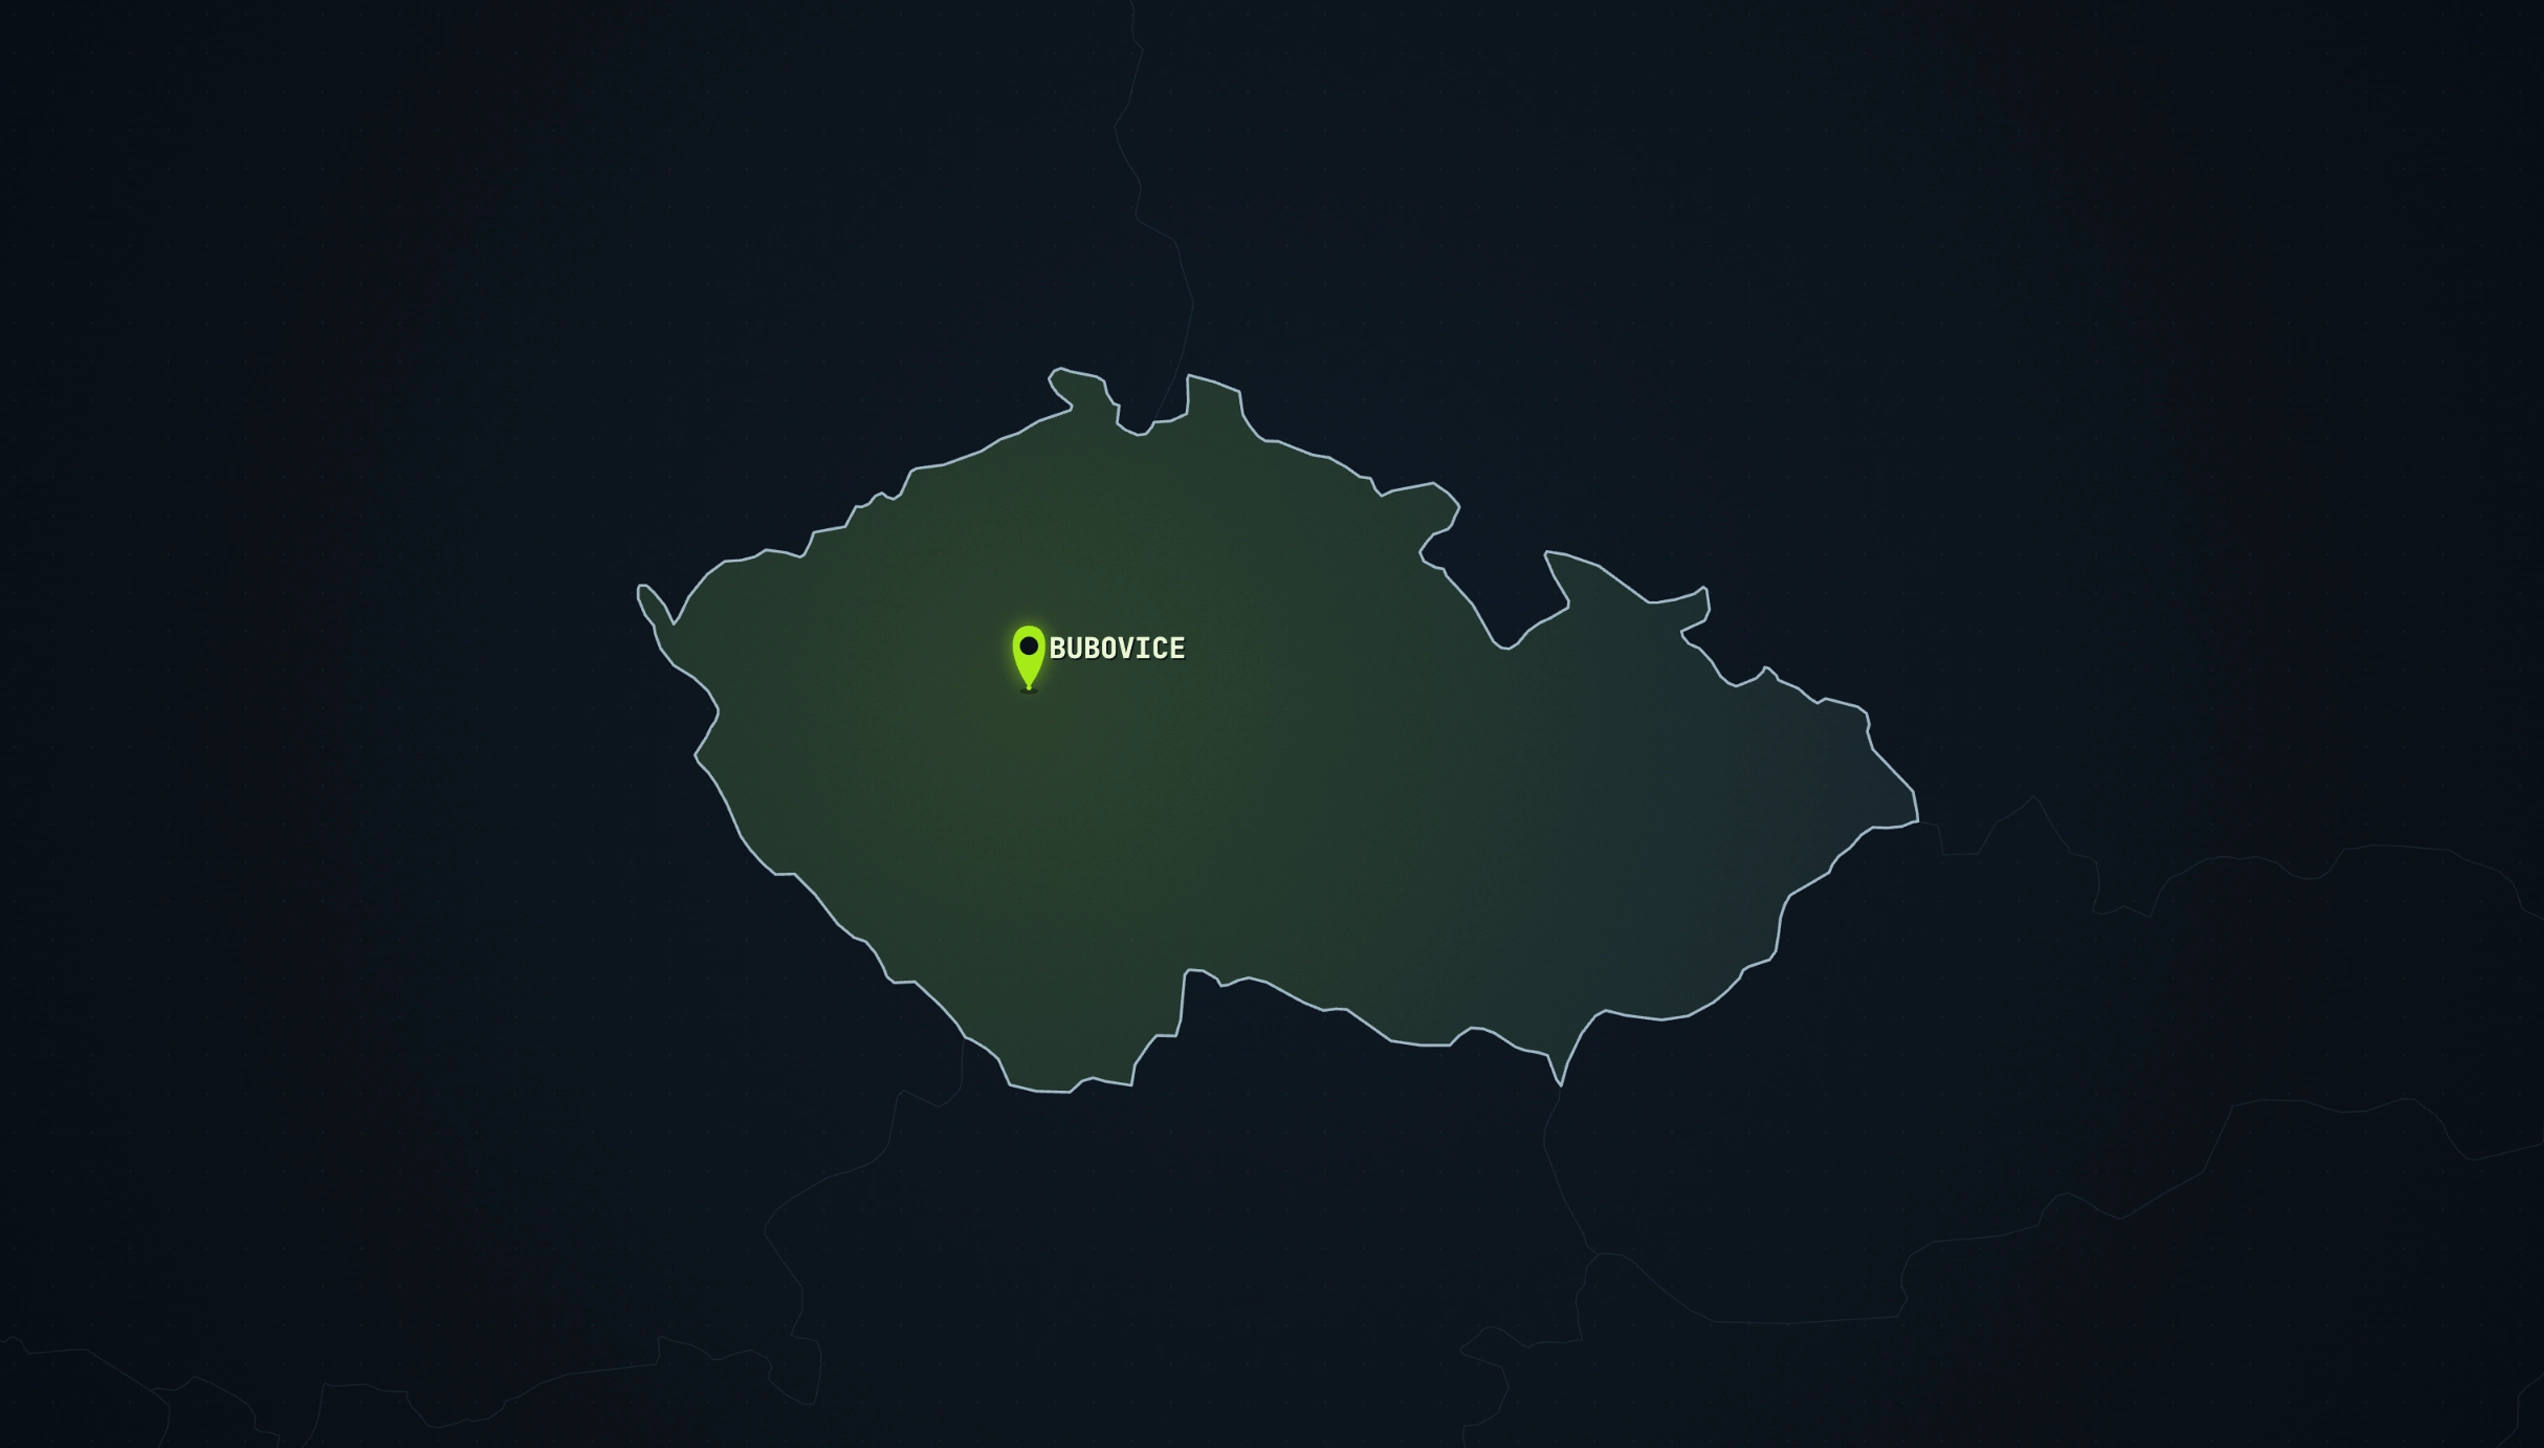
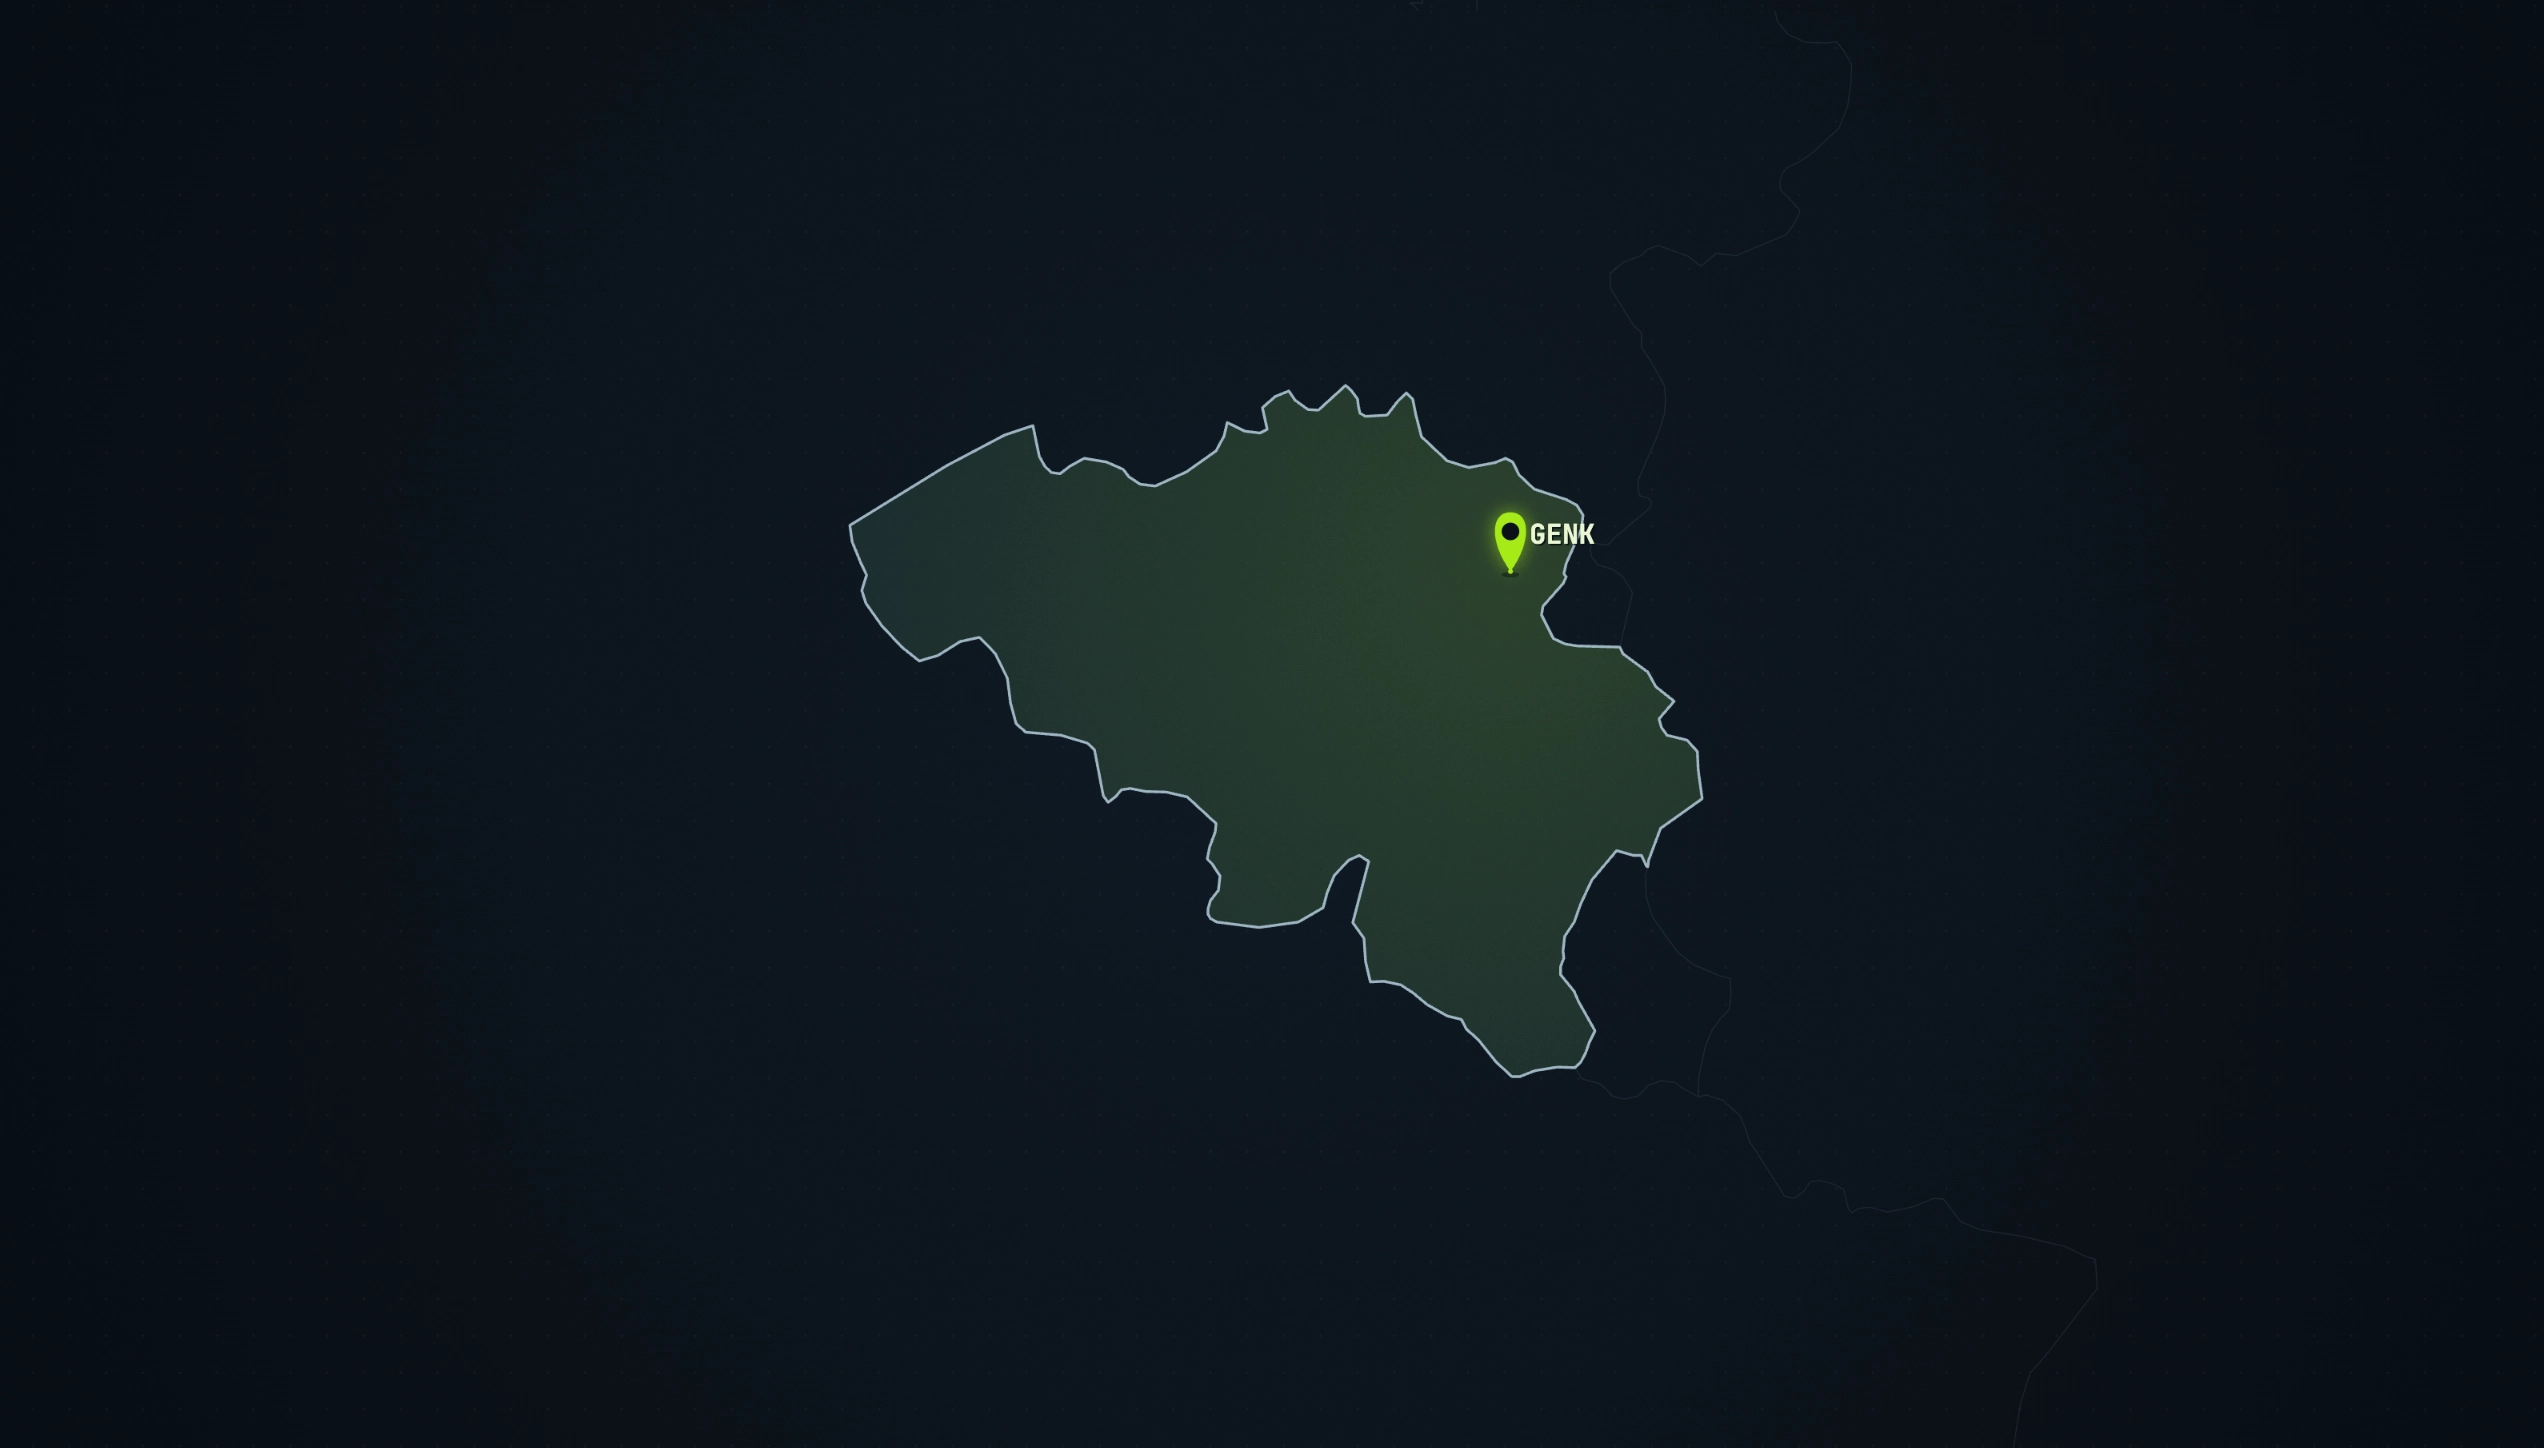
These are real installations operators have published in Skyprint. Open any one and explore the live, interactive report yourself.
See all reference instalations
Built for whoever runs the airspace.
Public safety & law enforcement
Situational awareness and a record of what flew, on demand.
Critical infrastructure & airports
Coverage and incident history across the protected perimeter.
Event security
Per-event airspace activity, ready to report after the fact.
Any Scout operator
Anyone who needs to show what their deployment is doing.
.svg)

// two jobs, one report
For the people who act on it, and the people who fund it.
A Scout deployment produces detections continuously. Two groups need to do something with them, and Skyprint serves both without switching tools.
the security team
Understand and decide
Drill into any flight, trace a returning drone across days, check which flights crossed the altitude limit or were likely flown beyond line of sight. The interactive report is a working surface, not a snapshot, so the people on the ground can read the situation and act on it.
the people they answer to
See the value, on paper
Export the same report to PDF or share a link. A chief, a city, or a customer sees what the deployment has picked up over the period, in a form built to be handed over, without anyone needing to log in or interpret a raw dashboard.
From the headline number down to the raw flight.
01
Public safety & law enforcement
Situational awareness and a record of what flew, on demand.
02
Activity over time
Daily volume, a calendar heatmap, and the hours of the day your airspace is busiest.
03
Spatial coverage
An interactive flight map plus per-receiver coverage range and bearing.
04
Flight behaviour
Altitude against detection range, and the speed profile of what flew.
05
Fleet composition
The top manufacturers and models detected, by unique serial.
06
Drone biographies
The full history of every individual drone seen, returning visitors and one-offs.
07
Compliance flags
Flights worth a closer look, with the basis each flag is drawn from.
08
Raw data
The full, sortable flight table. Export to CSV or JSON.